What Are Google Core Web Vitals, And Why They Matter
If you use Google Webmaster Tools to check out the status of your site, you might notice something called “Google Core Web Vitals.”
These are metrics Google uses to determine how healthy your website is. But, what does it all mean? And, more importantly, how can you use this info to make your website more profitable?
In a nutshell, Core Web Vitals is an update to Google’s search results algorithm, that considers many aspects of your website experience when browsing a website.
Google’s Core Web Vitals are things like:-
- If your site is mobile-friendly
- How quickly the first visible part of the page is ‘painted’ on the device
- How ‘accessible’ the page is for people hard of sight
- Whether there are any coding issues
- Whether your page is following basic search engine optimisation advice.
In this post, we’re going to take a look at what Google Core Web Vitals are and why you should care. We’ll cover everything from how to measure them to how you can start improving your search engine optimisation (SEO).
Why Do Core Web Vitals Matter?
Before we look in detail at what Core Web Vitals are, let’s first take a quick look at why your website speed and responsiveness matter.
Core Web Vitals have an impact on your conversion rate, bounce rate, and time on site. Google uses a large variety of factors to determine the ranking of a web page and Google’s Core Web Vitals form part of this.
In part, Core Web Vitals looks at how well the page performs on a range of web metrics—things like speed, responsiveness and the page’s loading time.
In June of 2021, when Google updated its search results algorithm, it was much more focused on making the user experience (UX) the second most important ranking factor after content.
That means if your website is not up to speed with regards to its Core Web Vitals, it may be penalised or at least may give some priority to your competitor’s websites that may score better on Core Web Vitals. All this may have an effect on your website’s position in the Google search ranking.
The best way to start is to what your website’s strengths and weaknesses are, and then address these in a strategic manner.
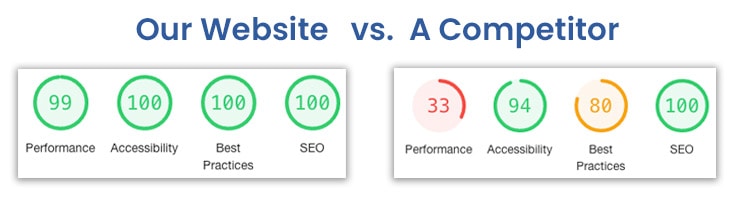
Below we’ll go into a little detail about the Core Web Vitals – Performance, Accessibility, Best Practices and SEO.
How to check Core Web Vitals
If you open your website in the Google Chrome Browser, press the 3 dots top right, select ‘More Tools’, and then select ‘Developer Tools’, a new window will open with a series of tabs. Select the ‘Lighthouse’ tab and run the report…

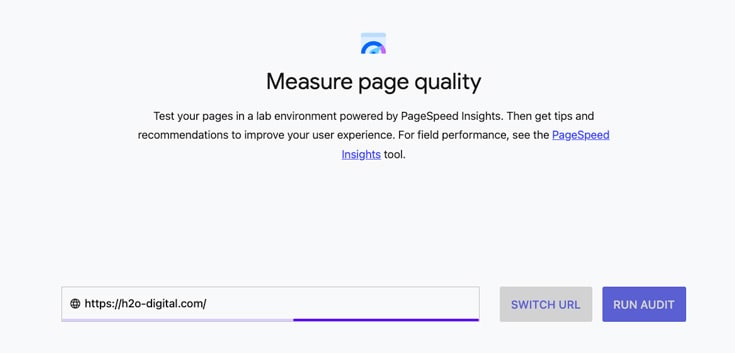
Alternatively, you can go to the ‘web.dev’ website, enter your website address and a report will be generated.
Another tool worth mentioning is Experte Page Speed tester which allows you to test hundreds of URLs automatically. All you have to do is enter a URL, and the tool crawls the website and determines the page speed scores for each subpage. The data yielded is said to be identical to the data of Google PageSpeed Insights.
Once you have your report, there will be plenty to digest and we’ll cover some of these below.
Note, that Google scores differently for both mobile and desktop.
Google really wants the mobile version of any website to score as high as possible, so in this article, we will be concentrating on the mobile reports. And, if you have good mobile scores, then the desktop version will do very well anyway.
Performance
The Performance metric is scored on a scale of 0 to 100 and is by far the most time-consuming metric to get a good score.
But, what affects performance? Let’s take a look at the measurements …
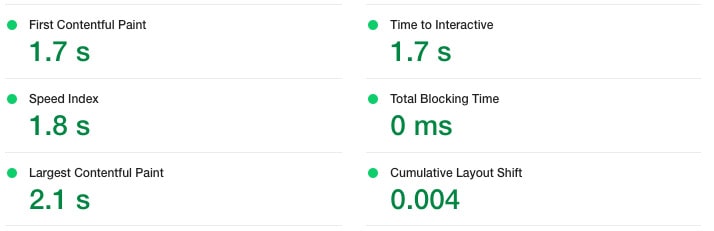
First Contentful Paint
First Contentful Paint marks the time at which the first text or image is painted. FCP measures how long it takes the browser to render the first piece of page content after a user navigates to your page. Learn more about First Contentful Paint.
Speed Index
Speed Index shows how quickly the contents of a page are visibly populated. Learn more about Speed Index.
Largest Contentful Paint
LCP measures when the largest content element in the viewport is rendered to the screen. This approximates when the main content of the page is visible to users. Learn more about Largest Contentful Paint
Time to Interactive
Time to interactive is the amount of time it takes for the page to become fully interactive. Measuring TTI is important because some sites optimise content visibility at the expense of interactivity. This can create a frustrating user experience: the site appears to be ready, but when the user tries to interact with it, nothing happens. Learn more about Time to Interactive.
Total Blocking Time
Sum of all time periods between FCP and Time to Interactive, when task length exceeded 50mexpressed in milliseconds. TBT measures the total amount of time that a page is blocked from responding to user input, such as mouse clicks, screen taps, or keyboard presses. Learn more about Total Blocking Time.
Cumulative Layout Shift
Cumulative Layout Shift measures the movement of visible elements within the viewport. Have you ever been reading an article online when something suddenly changes on the page? Without warning, the text moves, and you’ve lost your place. Or even worse: you’re about to tap a link or a button, but in the instant before your finger lands—BOOM—the link moves, and you end up clicking something else. Learn more about Cumulative Layout Shift.
Understanding how the performance score is calculated
The six measurements above are just based on the timings that Google recorded and all contribute to the performance score.
At the time of writing, there are 33 audits that Google uses to create the Performance score.
- Eliminate render-blocking resources – Resources are blocking the first paint of your page. Consider delivering critical JS/CSS inline and deferring all non-critical JS/styles.
- Properly size images – Serve images that are appropriately-sized to save cellular data and improve load time.
- Defer offscreen images – Consider lazy-loading offscreen and hidden images after all critical resources have finished loading to lower time to interactive.
- Minify CSS – Minifying CSS files can reduce network payload sizes.
- Minify JavaScript – Minifying JavaScript files can reduce payload sizes and script parse time.
- Reduce unused CSS – Reduce unused rules from stylesheets and defer CSS not used for above-the-fold content to decrease bytes consumed by network activity.
- Reduce unused JavaScript – Reduce unused JavaScript and defer loading scripts until they are required to decrease bytes consumed by network activity.
- Efficiently encode images – Optimised images load faster and consume less cellular data.
- Serve images in next-gen formats – Image formats like WebP and AVIF often provide better compression than PNG or JPEG, which means faster downloads and less data consumption.
- Enable text compression – Text-based resources should be served with compression (gzip, deflate or brotli) to minimise total network bytes.
- Preconnect to required origins – Consider adding `preconnect` or `dns-prefetch` resource hints to establish early connections to important third-party origins.
- Initial server response time was short – Keep the server response time for the main document short because all other requests depend on it.
- Avoid multiple page redirects – Redirects introduce additional delays before the page can be loaded.
- Preload key requests – Consider using `<link rel=preload>` to prioritize fetching resources that are currently requested later in page load.
- Use HTTP/2 – HTTP/2 offers many benefits over HTTP/1.1, including binary headers and multiplexing.
- Use video formats for animated content – Large GIFs are inefficient for delivering animated content. Consider using MPEG4/WebM videos for animations and PNG/WebP for static images instead of GIF to save network bytes.
- Remove duplicate modules in JavaScript bundles – Remove large, duplicate JavaScript modules from bundles to reduce unnecessary bytes consumed by network activity.
- Avoid serving legacy JavaScript to modern browsers – Polyfills and transforms enable legacy browsers to use new JavaScript features. However, many aren’t necessary for modern browsers. For your bundled JavaScript, adopt a modern script deployment strategy using module/nomodule feature detection to reduce the amount of code shipped to modern browsers, while retaining support for legacy browsers.
- Preload Largest Contentful Paint image – Preload the image used by the LCP element in order to improve your LCP time. Avoids enormous network payloads Large network payloads cost users real money and are highly correlated with long load times.
- Uses efficient cache policy on static assets – A long cache lifetime can speed up repeat visits to your page.
- Avoids an excessive DOM size 702 elements – A large DOM will increase memory usage, cause longer style calculations, and produce costly layout reflows.
- User Timing marks and measures – Consider instrumenting your app with the User Timing API to measure your app’s real-world performance during key user experiences.
- JavaScript execution time – Consider reducing the time spent parsing, compiling, and executing JS. You may find delivering smaller JS payloads helps with this.
- Minimises main-thread work – Consider reducing the time spent parsing, compiling and executing JS. You may find delivering smaller JS payloads helps with this.
- All text remains visible during webfont loads – Leverage the font-display CSS feature to ensure text is user-visible while webfonts are loading
- Minimise third-party usage – Third-party code can significantly impact load performance. Limit the number of redundant third-party providers and try to load third-party code after your page has primarily finished loading.
- Lazy load third-party resources with facades – Some third-party embeds can be lazy-loaded. Consider replacing them with a facade until they are required.
- Largest Contentful Paint image was not lazily loaded – Above-the-fold images that are lazily loaded render later in the page lifecycle, which can delay the largest contentful paint.
- Uses passive listeners to improve scrolling performance – Consider marking your touch and wheel event listeners as `passive` to improve your page’s scroll performance.
- Avoids
document.write()– For users on slow connections, external scripts dynamically injected via `document.write()` can delay page load by tens of seconds. - Avoid non-composited animations – Animations which are not composited can be janky and increase CLS.
- Image elements have explicit
widthandheight– Set an explicit width and height on image elements to reduce layout shifts and improve CLS. - Has a
<meta name="viewport">tag withwidthorinitial-scale– A `<meta name=”viewport”>` not only optimises your app for mobile screen sizes, but also prevents a 300-millisecond delay to user input.
How to improve performance scores
As you can see, the above 33 audits need to pass and every website and web hosting solution will need a different approach to improve the performance score.
The biggest effect is what theme and page builder was employed and can massively affect how the various audits listed below are scored.
Most websites that use a ‘page builder’ will be in the region of 40 to 50%.
This score much depends on how and what technology was employed to build a website. Even the type of web hosting will have an effect on the results.
While page builders give the user the flexibility to edit their own pages, they do add some ‘bloated’ code to the website.
However, the Gutenberg page builder (assuming you are using WordPress) now offers are a good range of flexibility for the casual website editor and has come on a long way in the last few years.
The best option to ensure you are using up to date software, a lightweight theme on your website, a lightweight page builder, good caching software and a great website hosting company.
Accessibility
The Accessibility metric is scored on a scale of 0 to 100 and is probably the easiest metric to get a good score.
Accessibility refers to the experience of users who might be outside the narrow range of the “typical” user, who might access or interact with things differently than you expect.
Specifically, it concerns users who are experiencing some type of impairment or disability — and bear in mind that that experience might be non-physical or temporary.
“Accessibility” can be difficult to spell, but it doesn’t have to be difficult to accomplish. There are many easy wins to help improve accessibility with minimal effort to create polished accessible experiences.
Broadly speaking, when we say a site is accessible, we mean that the site’s content is available, and its functionality can be operated, by literally anyone.
How to improve Accessibility scores
At the time of writing, there are 44 audits that google performs on your website.
We won’t list them all here, but in the main, it is checking that perhaps your text colour, on a white background, is not too light.
Grey text on a white background might be hard to see for people with impaired sight.
If you have red text on a green button, this would also get highlighted.
If we look at the BBC website, at the time of writing this article it scores 100% in Accessibility as you would expect…
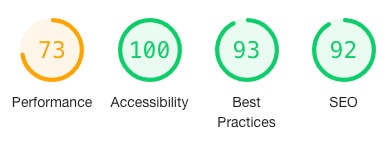
Amazon’s website does not score as well for Accessibility…
And the report will try and show you where the problem lies, although in our experience, sometimes are screenshots in the report are a little bit off…

Best Practices
The ‘Best Practices’ metric is scored on a scale of 0 to 100 and is probably the medium-difficult metric to get a good score.

Best Practice is mainly about coding errors, security loopholes, privacy, images sizes and image resolution etc.
How to improve Best Practices scores
There are 17 audits that Google performs against your website.
Sometimes you might have 3rd party software or ‘Plugins’ that can cause such issues, so they have to be replaced or fixed.
We cannot give much guidance here, other than to work with a developer that works through the issue list and resolves them one by one.
SEO
The ‘SEO’ metric is scored on a scale of 0 to 100 and in most cases is an easy metric to get a good score if the website has been built correctly to start with.

These checks ensure that your page is following basic search engine optimisation advice.
How to improve your SEO scores
There are 14 audits that Google performs against your website.
It is important to note that the SEO score is not saying that your website necessarily has good SEO and keyword optimisation etc, but that it has certain ‘things’ in place.
For example, it checks that your webpage has a <title> in place. It does not measure how good that <title> is, in comparison with your competitors. It checks that your website is indexable and that links are crawlable and buttons are of an appropriate size (which I think should be in ‘Accessibility’ rather than ‘SEO’, but hey, you can’t argue with Google!)
Our own website
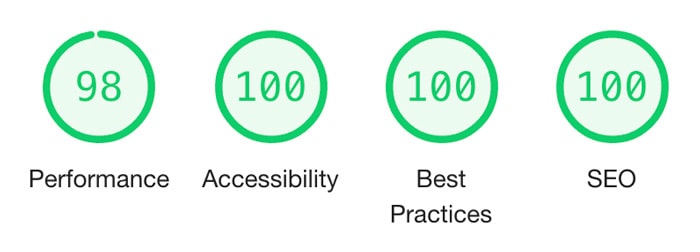
The home page for this website typically scores between 97% to 99% on performance, depending on when the report is run, and 100% on all other metrics – on both mobile and desktop.
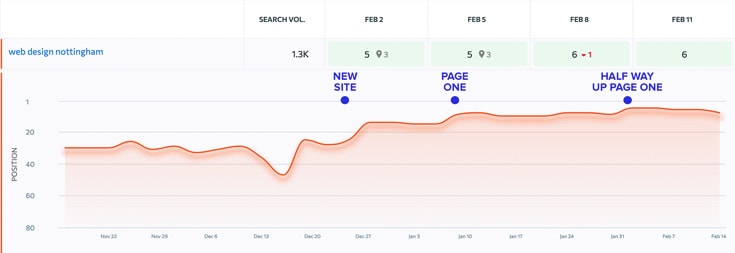
Historically, we have always prided ourselves for being on the first page of Google for “Web Design Nottingham” and every year we would rebuild our website to keep up with the trends. However, in recent years, we have let this slip with the last rebuild being mid-2018. Now in 2022, we are ready to take on the challenge once more.
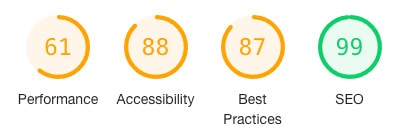
We recently rebuilt our website and the score immediately went up from 41% to around 86% just by using more modern website build techniques. Then literally after a few days of tinkering, we managed to get it into the high 98’s…
Within days, our position on Google for “Web Design Nottingham” went from being on page 4 or 5 (what happens when you don’t keep your website up to date), to the top of page 2.
Within 2 weeks we were back on page one.
Within 6 weeks we were halfway up on page one.
The website structure and content largely remains the same, we just used newer technologies.
Conclusion
In conclusion, Google Core Web Vitals (GWV) is a set of metrics that Google has defined to be “essential” for measuring the performance of websites. GWV are based on a number of performance factors that will help webmasters to understand why their website is loading and performing poorly. The metrics also provide a guide for improving the user experience.
If you want to improve the performance of your website and get more traffic from Google, then you need to know about “Core Web Vitals” which are explained above.
To find out how to make your site more responsive and increase its chances of ranking high on Google, just get in touch we can help.
If you are planning on building a new website soon, take a look at our website planning blog.